3
\$\begingroup\$

I am trying to implement a simple modelling pipeline with rolling c.v., making use of the TimeSeries split. The code is provided below with a working example dataset. (please don't pay too much attention to the dataset construction, it is a way to get a working exemple for the pipeline, not a way to replicate a good regression problem).

import pandas as pd, numpy as np
import seaborn as sns, matplotlib.pyplot as plt

from sklearn.datasets import make_regression
from sklearn.dummy import DummyRegressor
from sklearn.metrics import mean_squared_error
from sklearn.model_selection import TimeSeriesSplit


X_test, y_test = [], []

start_year = 2010
end_year = 2020

#create data    
for year in np.arange(start_year, end_year+1):
    X_year, y_year = make_regression(n_samples=5, n_features=2, noise=1, random_state=year)
    X_year = pd.DataFrame(X_year).rename(columns={0:'X1', 1:'X2'})
    X_year['year'] = year
    y_year = pd.Series(y_year)
    X_test.append(X_year)
    y_test.append(y_year)
    
X_test, y_test = pd.concat(X_test), pd.concat(y_test)

# modelling

X = X_test
y = y_test
years = np.unique(X_test['year'])

# modelisation
model = DummyRegressor(strategy="mean")
metric = mean_squared_error
cv_scheme = TimeSeriesSplit(n_splits=len(years)-1)

years_folds = []
res = []

for i, (train_year, test_year) in enumerate(cv_scheme.split(years)):
    
    print(f"Fold {i}:")
    print(f"  Train: index={years[train_year]}")
    print(f"  Test:  index={years[test_year]}")
    
    years_folds.append((years[train_year], years[test_year]))
    
    train_filter = X['year'].isin(years[train_year])
    test_filter = X['year'].isin(years[train_year])
    
    X_train, y_train = X.loc[train_filter.values], y[train_filter.values]
    X_test, y_test = X.loc[test_filter.values], y[test_filter.values]
    
    model.fit(X_train, y_train)
    preds = model.predict(X_test)
    score = metric(preds, y_test)
    print(f' {score=:.3}')
    res.append((years[test_year][0], score))
  
folds_res = pd.DataFrame(res,columns=['test_year', metric.__name__])
folds_res.plot.scatter(x='test_year', y=metric.__name__, title=f'{metric.__name__} over test_year');

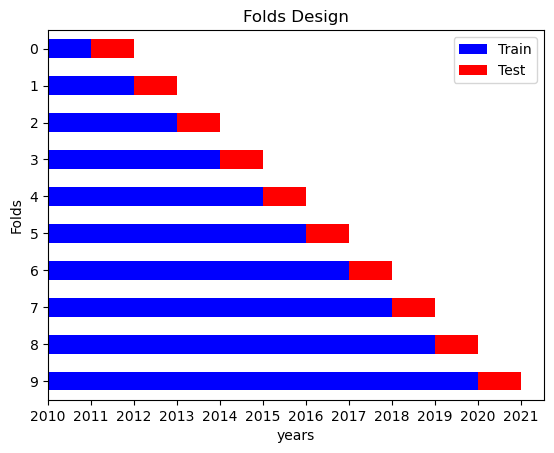
The code produces the expected output, that is it perform a cross validation with the scheme illustrated below.

enter image description here

However, I am wondering if this can be simplified, notably:

  • The cv split is done on year then the data is filtered based on years splits, isn't there a more natural way to use the spliter?
  • Isn't there a better pipeline approach to handle everything without a loop ? (just a function taking model, metric and cv scheme and outputting the results per fold / the plot)
  • Can this be extended to parameter tuning?
\$\endgroup\$

1 Answer 1

2
\$\begingroup\$

filtering vs slicing

Given a vector v of (y, m, d) chronologically ordered timestamps, it is certainly possible to pick out instances from a given year by scanning N instances, doing N equality tests. But it would be more natural to identify start and end indexes, and use python's slicing syntax: v[start:end]

The emphasis on putting "year" in this code's identifiers, and hardcoding a 12-month interval, may be distracting a little from applying such a slicing approach.

reproducible

for year in np.arange(start_year, end_year+1):
    X_year, y_year = make_regression(n_samples=5, n_features=2, noise=1,
                                     random_state=year)

Kudos on seeding the PRNG so we get reproducible numbers from it.

different problems

(please don't pay too much attention to the dataset construction)

But the manner of construction makes a difference.

This code (pseudo-)randomly produces eleven different regression problems, which are related to one another only by having the same 5 × 2 shape. The adjacent years make them superficially appear to be related, but your setup is very different from observing a single generating process that ran for eleven years.

The cv split is done on year then the data is filtered based on years splits, isn't there a more natural way to use [a] splitter?

Yes. Assume we have datetime64[ns] timestamps on a timeseries produced by a single generating process. It possibly has a trend, seasonality, and a small number of system disturbances injected at arbitrary points. Typical external disturbances might include war, pandemics, extreme weather events, interest rate changes, or product launches.

Arbitrarily pick K validation points, and loop over them. Take the slice up to that point as "train", and the remainder as "test". (Or you might prefer to always truncate the test set to some conveniently small window.) Evaluate the model. This simulates a model that historically was produced and run at that validation point, making predictions which by now we know the true answer to. Notice that this approach is different from what TimeSeriesSplit offers.

Isn't there a better pipeline approach to handle everything without a loop ?

Yes, simply choose K=1, so we have a single validation point. (And we'll choose to say that reading values from a slice is not "looping".)

Can this be extended to parameter tuning?
I think this is a reference to the hyperparameters of a model.

Yes.

However, beware of data leakage. We want the model to generalize, so it shows good performance on out-of-sample instances. Repeatedly running a grid search loop over that same data subjects it to a little bit of leakage on each iteration.

Ensure that you begin the exercise with enough data, certainly more than the n_samples=5 we see here. Sequester a portion of it as a "hold out" dataset, which training and scoring never see during model development. Only when you're done, are writing up the paper, and want to know the "true" performance do you score the model against the held-out data. At that point you write it down, and close the project. (If you wanted to iterate at this point, you would need to have created additional hold-out datasets to support that.)

\$\endgroup\$
2
  • \$\begingroup\$ I am aware of how to deal with time leakage. And it is the purpose of the code. That is, it currently runs so that it does what you say with increment of one year. What I am looking for is more "pythonic". \$\endgroup\$ Commented Apr 17 at 16:22
  • \$\begingroup\$ More pythonic implementation, notably using sklearn API interface. \$\endgroup\$ Commented Apr 18 at 5:55

Your Answer

By clicking “Post Your Answer”, you agree to our terms of service and acknowledge you have read our privacy policy.

Not the answer you're looking for? Browse other questions tagged or ask your own question.