7
\$\begingroup\$

The script below is used to determine relay operating times, as defined in the standard IEC 60255. The equation and relevant information can be found here.

curve_equation takes three input values, and outputs a list of values representing the trip times for currents in the fixed range np.logspace(np.log10(Is), 5, 1e2).

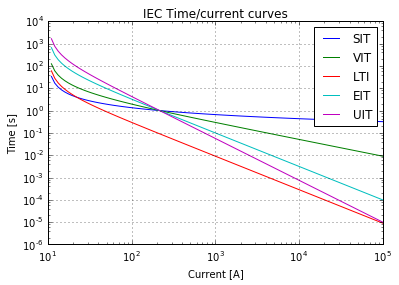
The part in the bottom plots the trip times for the different curves. The function curve_equation will be used to much more than that, so I'm mostly interested in improvements to that one.

# -*- coding: utf-8 -*-
"""
Created on Sun Apr 29 13:28:26 2018

@author: Stewie
"""
import numpy as np
import matplotlib.pyplot as plt

def curve_equation(curve_name, T, Is):
    """ 
    This function calculates and returns the inverse curves for 
    the selected curve type.
    Input:
        curve_name: one of the strings: "SIT", "VIT", "LTI", "EIT", "UIT"
        T: The time dial setting. Typically in the range 0.1 ... 1
        Is: The current setting. Typically in the range 100-10000

    The appropriate k, alpha and theta values are selected based on the
    curve type.
    """

    # Define constants to be used in the curve equation    
    k = (0.14, 13.5, 120, 80, 315.2)
    alpha = (0.02, 1, 2, 2, 2.5)
    beta = (2.97, 1.5, 13.33, 0.808, 1)    
    curve_types = ("SIT", "VIT", "LTI", "EIT", "UIT")

    # idx is the index of the values we want
    try:
        idx = curve_types.index(curve_name)
    except:
        print("Non-existing curve-type")
        return

    I = np.logspace(np.log10(Is), 5, 1e2)

    def td_equation():
        td = k[idx]/((I/Is)**alpha[idx]-1) * (T / beta[idx])
        return(td)

    return(td_equation())

# For testing / plotting purposes:   
curve_types = ("SIT", "VIT", "LTI", "EIT", "UIT")
I = np.logspace(1, 5, 1e2)
for curve_type in curve_types:
    plt.loglog(I, curve_equation(curve_type, 1, 1e2), label=curve_type)

plt.xlabel("Current [A]")
plt.ylabel("Time [s]")
plt.title("IEC Time/current curves")
plt.grid()
plt.legend()

enter image description here

\$\endgroup\$
2
  • \$\begingroup\$ I get a NameError: name 'I' is not defined error on the plt.loglog(I, …) line. \$\endgroup\$ Commented Apr 29, 2018 at 19:19
  • \$\begingroup\$ @200_success thanks for noticing! It should work now. I made a mistake and removed that line.I was already stored as a variable outside the function so I didn't get an error message when I removed it. \$\endgroup\$ Commented Apr 29, 2018 at 19:26

1 Answer 1

7
\$\begingroup\$

You need not declare # -*- coding: utf-8 -*- in Python 3: UTF-8 is the default.

Writing I = np.logspace(…) inside your curve_equation function is bad practice, because it hard-codes certain x-values for your plot. In fact, your plot is wrong, because the calculations are for \$I_s\$ values ranging from 102 A to 105 A (due to the inner I = np.logspace(np.log10(Is), 5, 1e2)), but your plot's x axis is labelled as if the values ranged from 101 A to 105 A (due to the outer I = np.logspace(1, 5, 1e2)). Specifically, four of the curves should intersect at 1 kA, 10 s.

I also find the way in which the curves are specified very cumbersome. You have five magic strings ("SIT", "VIT", etc.) which you search for in curve_types. Then, you retrieve the k, alpha, and beta parameters by using the corresponding index. Printing an error message and returning None is an inappropriate error-handling mechanism; you should raise or propagate an exception for such a fatal error.

I'd rather specify the parameters the other way: each curve should be defined as a \$(k, \alpha, \beta)\$ tuple. To do that, I would use namedtuples. I'd go a bit further and make each namedtuple smart enough to know what its own \$td(I)\$ function looks like, when \$T\$ and \$I_s\$ are specified.

from collections import namedtuple
import numpy as np
import matplotlib.pyplot as plt

class IEC_Curve(namedtuple('IEC_Curve', 'name k alpha beta')):
    def td(self, T, Is):
        """
        The td(I) function for a given IEC curve, time dial setting, and
        current setting.
        """
        return lambda I: self.k * T / self.beta / ((I / Is)**self.alpha - 1)

SIT = IEC_Curve('SIT', k=0.14, alpha=0.02, beta=2.97)   # Standard inverse / A
VIT = IEC_Curve('VIT', k=13.5, alpha=1, beta=1.5)       # Very inverse / B
LTI = IEC_Curve('LTI', k=120, alpha=2, beta=13.33)      # Long time inverse / B
EIT = IEC_Curve('EIT', k=80, alpha=2, beta=0.808)       # Extremely inverse / C
UIT = IEC_Curve('UIT', k=315.2, alpha=2.5, beta=1)      # Ultra inverse

I = np.logspace(2, 5, 1e2)
for curve in (SIT, VIT, LTI, EIT, UIT):
    plt.loglog(I, curve.td(T=1, Is=1e2)(I), label=curve.name)
plt.xlabel("Current [A]")
plt.ylabel("Time [s]")
plt.title("IEC Time/current curves")
plt.grid()
plt.legend()
plt.show()

Note that td is a method that returns a function. To calculate values of \$td\$ with fixed \$T\$, fixed \$I_s\$, and swept \$I\$:

UIT.td(T=1, Is=1e2)(I=np.logspace(2, 5, 1e2))

To calculate a value of \$td\$ for a given \$T\$, \$I_s\$, and \$I\$:

UIT.td(T=1, Is=1e2)(I=1e2)

(This happens to cause a ZeroDivisionError, which manifests itself as a RuntimeWarning: divide by zero encountered in divide at the beginning of the sweep.)


In case you feel intimidated by my use of inheritance of namedtuple, you could use a manually written constructor instead:

class IEC_Curve:
    def __init__(self, name, k, alpha, beta):
        self.name = name
        self.k = k
        self.alpha = alpha
        self.beta = beta

    def td(self, T, Is):
        return lambda I: self.k * T / self.beta / ((I / Is)**self.alpha - 1)

One difference is that namedtuples are immutable, whereas the members here are mutable.

\$\endgroup\$
5
  • \$\begingroup\$ Thanks! I was originally planning on using the namedtuple approach, but didn't know how to do it, since I've never heard of it. I only knew about key, value pairs, and I needed more than one value per key. \$\endgroup\$ Commented Apr 29, 2018 at 20:24
  • \$\begingroup\$ Hardcoding the I-values was actually intentional, since the range of the plot is usually fixed, and giving I as input would indicate that it's a variable, when it actually isn't. It's always from Is (which is already an input), and up to 10**5. Passing both Is and I is unnecessary since I doesn't give any information. I agree with you though... This is better! \$\endgroup\$ Commented Apr 29, 2018 at 20:28
  • \$\begingroup\$ How do I get the operating times (the list of values) from the function, when I know the curve type? I seldom want all values (that's why I have it as an input). \$\endgroup\$ Commented Apr 29, 2018 at 20:36
  • \$\begingroup\$ @StewieGriffin Just make it a dictionary with the names as the keys and the IEC_Curves as values. \$\endgroup\$
    – Graipher
    Commented Apr 29, 2018 at 20:44
  • \$\begingroup\$ Thank you so much for explaining how I can use it! This is great! \$\endgroup\$ Commented Apr 30, 2018 at 6:52

Your Answer

By clicking “Post Your Answer”, you agree to our terms of service and acknowledge you have read our privacy policy.

Not the answer you're looking for? Browse other questions tagged or ask your own question.