36
\$\begingroup\$

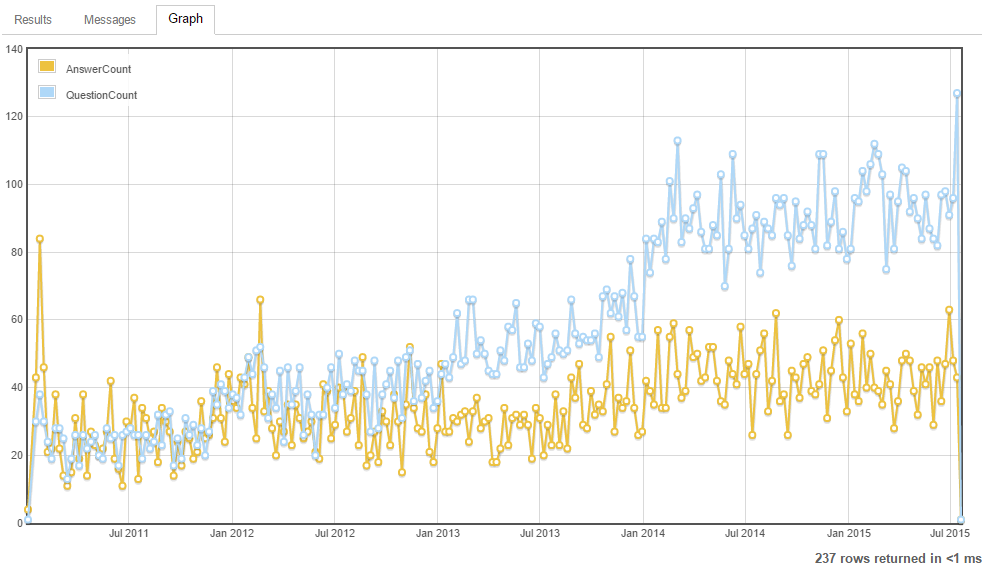
I had perceived an uptick in new reviewers around here, and I wanted to see if the data backed that observation up. It's been a while since I've written any SQL, so this was a nice little exercise in using the Stack Exchange Data Explorer.

The query finds the first question and first answer from every user, and then groups those first posts by week. It turns out that I was right, but the growth of first questions is outpacing the growth of first answers.

The query feels repetitive and I'm not a huge fan of the Full Outer Join. Is there a better way to write this?

WITH FirstAnswers
AS (
  SELECT 
    Users.Id UserId
    ,dateadd(week, datediff(week, 0, Convert(Date,Min(Posts.CreationDate))), 0) WeekOf
  FROM Posts
  INNER JOIN Users
    ON Posts.OwnerUserId = Users.Id
  WHERE PostTypeId = 2 --answer
    AND Posts.CreationDate > '2011-Jan-01' --There was very little activity prior to this date. Including it skews the graph.
  GROUP BY Users.Id 
), 

FirstQuestions
AS (
  SELECT 
    Users.Id UserId
    ,dateadd(week, datediff(week, 0, Convert(Date,Min(Posts.CreationDate))), 0) WeekOf
  FROM Posts
  INNER JOIN Users
    ON Posts.OwnerUserId = Users.Id
  WHERE PostTypeId = 1 --question
    AND Posts.CreationDate > '2011-Jan-01' --There was very little activity prior to this date. Including it skews the graph.
  GROUP BY Users.Id 
) 

SELECT ISNULL(a.WeekOf,b.WeekOf) As WeekOf
  , a.AnswerCount, b.QuestionCount
FROM (
  SELECT WeekOf, Count(UserId) AnswerCount
  FROM FirstAnswers
  GROUP BY WeekOf
) a
FULL OUTER JOIN (
  SELECT WeekOf, Count(UserId) QuestionCount
  FROM FirstQuestions
  GROUP BY WeekOf
 )b
ON a.WeekOf = b.WeekOf
ORDER BY WeekOf

First Qs & As Graph

\$\endgroup\$
2
  • 2
    \$\begingroup\$ Plotting the number of new users per week against this data would have been nice. \$\endgroup\$ Commented Jul 24, 2015 at 0:49
  • \$\begingroup\$ I'm not real sure how to make that happen @Mat'sMug. Open to suggestions. \$\endgroup\$
    – RubberDuck
    Commented Jul 24, 2015 at 0:55

3 Answers 3

22
\$\begingroup\$

Technically, the full outer join is insufficient. If during a certain week there was not a single user who posted their first question or answer, the plot for that week needs to be 0. It would be misleading to plot a direct line from the previous week to the following week, skipping the quiet week. So, strictly speaking, you need to generate a series of all the weeks, to which you LEFT OUTER JOIN the FirstQuestions and FirstAnswers CTEs. However, generating a date series in SQL Server is a hassle compared to some developer-friendlier databases. I'm willing to pretend that there aren't weeks with no new user activity (actually demonstrably false for the week of 2011-01-10).

First rewrite

All of the information you need is contained in the Posts table. There is no need to join the Users table.

The subselects in the query suggest that your CTEs are underdeveloped. In my first rewrite below, I've reorganized FirstAnswers and FirstQuestions to perform the role of your subselects.

a and q would make more meaningful table aliases than a and b.

Your function names are inconsistently capitalized: dateadd, datediff, Convert, Min, ISNULL. I believe that Convert(Date, …) isn't needed at all.

WITH FirstPosts AS (
  SELECT OwnerUserId As UserId
       , PostTypeId
       , DATEADD(week, DATEDIFF(week, 0, MIN(CreationDate)), 0) AS WeekOf
    FROM Posts
    WHERE CreationDate > '2011-01-01' -- There was very little activity prior to this date. Including it skews the graph.
    GROUP BY OwnerUserId, PostTypeId
), FirstAnswers AS (
  SELECT WeekOf
       , COUNT(UserId) AS UserCount
    FROM FirstPosts
    WHERE PostTypeId = 2 -- answer
    GROUP BY WeekOf
), FirstQuestions AS (
  SELECT WeekOf
       , COUNT(UserId) AS UserCount
    FROM FirstPosts
    WHERE PostTypeId = 1 -- question
    GROUP BY WeekOf
)
SELECT ISNULL(a.WeekOf, q.WeekOf) AS WeekOf
     , ISNULL(a.UserCount, 0) AS AnswerCount
     , ISNULL(q.UserCount, 0) AS QuestionCount
  FROM FirstAnswers AS a
    FULL OUTER JOIN FirstQuestions AS q
      ON a.WeekOf = q.WeekOf
  ORDER BY 1;

Better solution

As it turns out, there is a much slicker way to avoid the join altogether by using a conditional COUNT():

WITH FirstPosts AS (
  SELECT OwnerUserId As UserId
       , PostTypeId
       , DATEADD(week, DATEDIFF(week, 0, MIN(CreationDate)), 0) AS WeekOf
    FROM Posts
    WHERE CreationDate > '2011-01-01' -- There was very little activity prior to this date. Including it skews the graph.
    GROUP BY OwnerUserId, PostTypeId
)
SELECT WeekOf
     , COUNT(CASE WHEN PostTypeId = 2 THEN UserId END) AS AnswerCount
     , COUNT(CASE WHEN PostTypeId = 1 THEN UserId END) AS QuestionCount
  FROM FirstPosts
  GROUP BY WeekOf
  ORDER BY WeekOf;
\$\endgroup\$
2
  • 2
    \$\begingroup\$ What does Order By 1 do? In my mind, it shouldn't do anything at all. Fantastic answer btw! \$\endgroup\$
    – RubberDuck
    Commented Jul 24, 2015 at 9:27
  • 1
    \$\begingroup\$ Nevermind, stackoverflow had an answer for me. =D \$\endgroup\$
    – RubberDuck
    Commented Jul 24, 2015 at 10:18
14
\$\begingroup\$

'2011-Jan-01' --There was very little activity prior to this date. Including it skews the graph.

And then

'2011-Jan-01' --There was very little activity prior to this date. Including it skews the graph.

If that wasn't Copy+Paste'd, you've given your fingers a lot of work here. And if it was... well then, you've given yourself more work than you should need, to change the "start date".

declare @startDate datetime
set @startDate = '2011-01-01' --There was very little activity prior to this date. Including it skews the graph.

Why not stick to the ISO format, YYYY-MM-DD? Not that 2011-Jan-01 isn't readable, it's just... a little surprising, to me at least.

That said, @startDate is nice, but even nicer would be a SEDE parameter - and a notch nicer still, would be a SEDE parameter that lets you specify a number of weeks, and to have the script compute the @statDate; the query results works in weeks anyway, and then you could calculate the start date by ensuring you're only capturing full StackLand weeks. this way you avoid returning a less-meaningful first week figure, if today is Saturday for example (like Jan 1st, 2011 was).


SELECT ISNULL(a.WeekOf,b.WeekOf) As WeekOf

This is the only instance of the AS keyword I'm seeing that's used to specify a column alias. Be consistent, ditch it! :)

\$\endgroup\$
0
8
\$\begingroup\$

You can do this more succinctly by first grouping by the User and the Post Type to get a set of every first question and answer. Then group that set by the type of post and the week it occurred in. Finally use the PIVOT operator to pivot the rows into two columns so you can display it on the chart.

DECLARE @FirstDate DATE = '2011-01-01';  --There was very little activity prior to this date. Including it skews the graph.

SELECT WeekOf, Questions, Answers
FROM (
  SELECT WeekOf,
    CASE PostTypeId
      WHEN 1 THEN 'Questions'
      WHEN 2 THEN 'Answers'
    END AS PostType,
    COUNT(*) AS PostCount
  FROM (
    SELECT PostTypeId,
    DATEADD(week, DATEDIFF(week, 0, MIN(CreationDate)),0) AS WeekOf
    FROM Posts
    WHERE PostTypeId IN (1,2)
      AND CreationDate >= @FirstDate
    GROUP BY OwnerUserId, PostTypeId
  ) AS FirstPosts
  GROUP BY WeekOf, PostTypeId
) AS WeeklyCounts
PIVOT (
  MAX(PostCount)
  FOR PostType IN ([Questions],[Answers])
) AS p
ORDER BY WeekOf;

There isn't any need to join the Posts table to the Users table because we don't need any columns from there. Grouping by the OwnerUserId column is sufficient, it doesn't even need to be in the SELECT clause.

A variable to hold the starting week so it can be easily updated in the future can be useful.

I noticed that you've split all of your sub-queries out into CTEs. If I'm not using it in multiple places or doing recursion I don't use a CTE. Personally, I find it easier to read the sub-queries in-line rather than have to scroll up to see what they are doing.


One problem this doesn't solve is that if no new questions and answers are made in a week then that week won't appear in the result set. A recursive CTE can be used to generate a set of all of the dates in the period.

My date ranges aren't normally so large so I don't usually need to change the MAXRECURSION option but in this case there are more than 100 weeks in the set and 100 is the default maximum recursion limit. 300 will be sufficient.

A second variable is used to store the maximum post date for limiting the recursive CTE. If a variable wasn't used the query to determine the maximum post creation date would be run every time the CTE executed.

DECLARE @FirstWeek DATE = '2011-01-01';  --There was very little activity prior to this date. Including it skews the graph.

DECLARE @FinalWeek DATE = (
    SELECT MAX(CreationDate)
    FROM Posts
    WHERE PostTypeId IN (1,2)
);

WITH AllWeeks AS (
    SELECT DATEADD(week, DATEDIFF(week, 0, @FirstWeek), 0) AS WeekOf

    UNION ALL

    SELECT DATEADD(week, 1, WeekOf) AS WeekOf
    FROM AllWeeks
    WHERE WeekOf < @FinalWeek
)
SELECT AllWeeks.WeekOf, Questions, Answers
FROM AllWeeks
LEFT JOIN (
    SELECT WeekOf,
        CASE PostTypeId
            WHEN 1 THEN 'Questions'
            WHEN 2 THEN 'Answers'
        END AS PostType,
        COUNT(*) AS PostCount
    FROM (
        SELECT PostTypeId,
            DATEADD(week, DATEDIFF(week, 0, MIN(CreationDate)),0) AS WeekOf
        FROM Posts
        WHERE PostTypeId IN (1,2)
            AND CreationDate >= @FirstWeek
        GROUP BY OwnerUserId, PostTypeId
    ) AS FirstPosts
    GROUP BY WeekOf, PostTypeId
) AS WeeklyCounts
PIVOT (
    MAX(PostCount)
    FOR PostType IN ([Questions],[Answers])
) AS p ON p.WeekOf=AllWeeks.WeekOf
ORDER BY WeekOf
OPTION (MAXRECURSION 300);

Doing this will slow down your query of course.


Number of first posts and new users per week

\$\endgroup\$

Your Answer

By clicking “Post Your Answer”, you agree to our terms of service and acknowledge you have read our privacy policy.

Not the answer you're looking for? Browse other questions tagged or ask your own question.