24
\$\begingroup\$

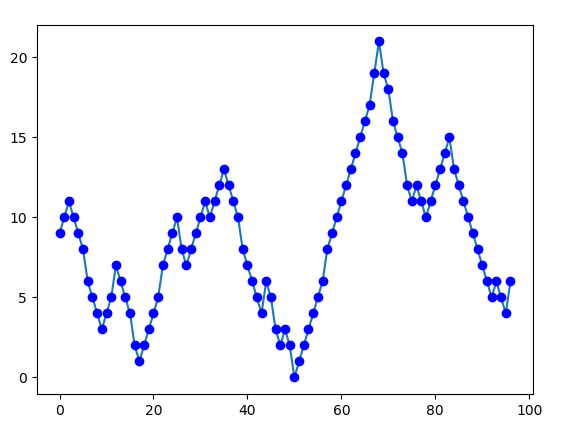
I wrote this code to remove points that create a straight line when plotted.

For instance, this has many points in a straight line:

import matplotlib.pyplot as plt
import numpy as np

pattern = np.array(
    [ 9, 10, 11, 10,  9,  8,  6,  5,  4,  3,  4,  5,  7,  6,  5,  4,  2,
      1,  2,  3,  4,  5,  7,  8,  9, 10,  8,  7,  8,  9, 10, 11, 10, 11,
     12, 13, 12, 11, 10,  8,  7,  6,  5,  4,  6,  5,  3,  2,  3,  2,  0,
      1,  2,  3,  4,  5,  6,  8,  9, 10, 11, 12, 13, 14, 15, 16, 17, 19,
     21, 19, 18, 16, 15, 14, 12, 11, 12, 11, 10, 11, 12, 13, 14, 15, 13,
     12, 11, 10,  9,  8,  7,  6,  5,  6,  5,  4,  6])

plt.plot(pattern)
plt.plot(pattern, 'bo')
plt.show()

enter image description here

Using the degrees function I can remove any lines that create an angle of 180deg between the two neighboring points.

from numpy.lib.stride_tricks import as_strided

def moving_slice(a, k):
    a = a.ravel()
    return as_strided(a, (a.size - k + 1, k), 2 * a.strides)

def degrees(x, y):
    x_window, y_window = moving_slice(x, 3), moving_slice(y, 3)
    x_window = np.concatenate((x_window, x_window[:, None, 0]), axis=1)
    y_window = np.concatenate((y_window, y_window[:, None, 0]), axis=1)

    triangle_sides = np.sqrt(np.square(np.diff(x_window)) + np.square(np.diff(y_window)))
    squared_sides = np.square(triangle_sides)

    cos_num = np.sum(squared_sides[:, :2], axis=1) - squared_sides[:, 2]
    cos_den = 2 * np.prod(triangle_sides[:, :2], axis=1)
    return np.degrees(np.arccos(cos_num / cos_den))

This is what I'm trying to achieve:

# My review function
angles = degrees(np.arange(len(pattern)), pattern)

pattern = pattern[1:-1] # <- No angles between the end points
less_than_180 = angles < 180
plt.plot(pattern[less_than_180])
plt.plot(pattern[less_than_180], 'bo')
plt.show()

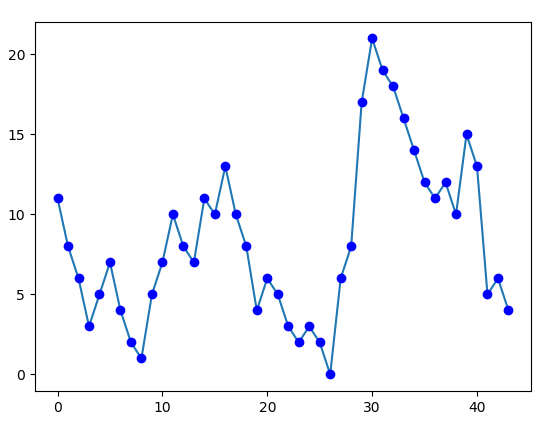
enter image description here

You can see that it's pretty good. Missed a few points to remove (due to decimal accuracy) but otherwise the function does what I want. I'd like to know if there is a simpler way to achieve the desired result without calculating all the angles. What do you think?

\$\endgroup\$
2
  • 3
    \$\begingroup\$ Consider that if dx between two adjacent points is the same, they have the same slope iff dy is also the same. If your dx is always fixed (as it is in your test example), this fact may help simplify things. \$\endgroup\$
    – Dan Bryant
    Commented Feb 8, 2018 at 17:58
  • \$\begingroup\$ @DanBryant good observation. Yes, in my use case x will always be consecutive integers. So that would work also. \$\endgroup\$ Commented Feb 8, 2018 at 23:12

3 Answers 3

25
\$\begingroup\$
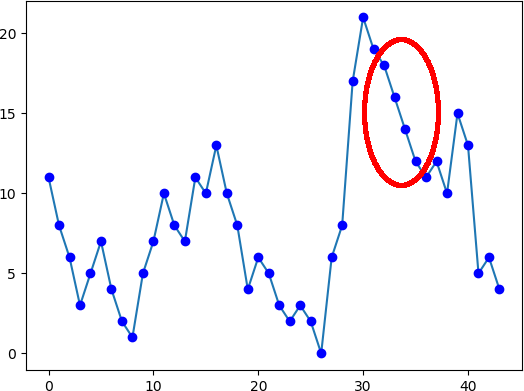
  1. A look at the second plot in the post shows that something has gone wrong. There are four points in a line here:

    plot from post with problem highlighted

    This shouldn't be possible, since "points that create a straight line when plotted" have been removed. How did this happen? A look at the \$x\$ axis shows the cause. The first plot has the \$x\$ coordinate running from 0 to 96, but the second plot has the \$x\$ coordinate running from 0 to 43, because the \$x\$ values for the omitted points have also been omitted.

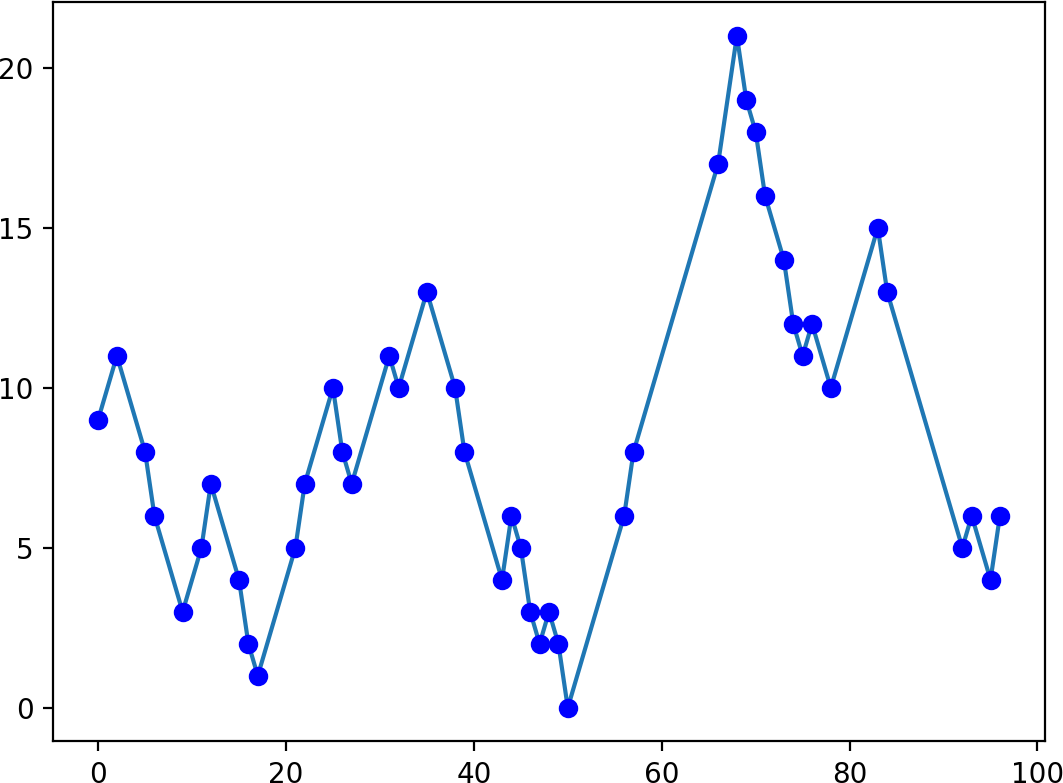
    To get the correct plot you have to remember the original \$x\$ coordinates and mask them at the same time as you mask the \$y\$ values, like this:

    x = np.arange(len(pat))[less_than_180]
    y = pat[less_than_180]
    plt.plot(x, y)
    plt.plot(x, y, 'bo')
    

    See below for the corrected plot.

  2. The name degrees could be better chosen — there are already functions math.degrees in the standard library, and numpy.degrees in NumPy, and a reader might well imagine that your function does something similar. A name like vertex_angle would be better (see Wikipedia).

  3. The line:

    pattern = pattern[1:-1] # <- No angles between the end points
    

    discards the endpoints of the data. But surely you want to keep the endpoints in the plot?

  4. Given three points \$A, B, C\$, the code finds the vertex angle \$∠ABC\$ and compares it with 180°. An alternative approach is to linearly interpolate between the endpoints, finding \$B′ = ½(A + C)\$, and see if \$B′\$ is close enough to \$B\$. Like this:

    # Boolean mask for the points we are going to plot.
    mask = np.ones_like(pattern, dtype=bool)
    
    if len(pattern) > 2:
        # Linearly interpolate between points that are two apart.
        interpolants = (pattern[:-2] + pattern[2:]) / 2
    
        # Don't plot points that are equal to their interpolant.
        mask[1:-1] = interpolants != pattern[1:-1]
    
    x = np.arange(len(pattern))[mask]
    y = pattern[mask]
    plt.plot(x, y)
    plt.plot(x, y, 'bo')
    plt.show()
    

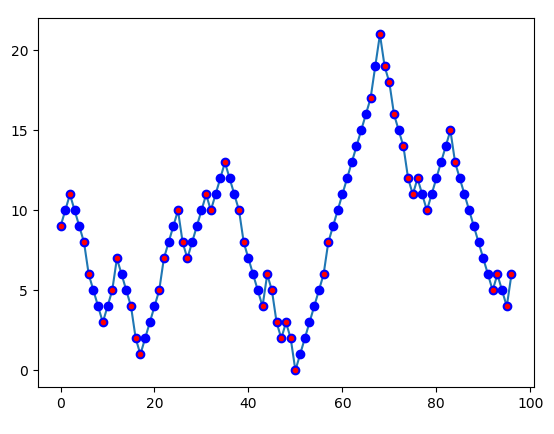
    Here's the resulting plot:

    result of running the code above

    If your data is floating-point then you will need some tolerance in the comparison of points to their interpolants. For example, you might use numpy.isclose:

    # Don't plot points that are close their interpolant.
    mask[1:-1] = ~np.isclose(interpolants, pattern[1:-1])
    
\$\endgroup\$
3
  • 1
    \$\begingroup\$ That's a fantastic answer! Thanks for your time. I wasn't aware of the term vertex angle or linearly interpolate I have some reading to do! And yes, I did want the end points :) \$\endgroup\$ Commented Feb 8, 2018 at 12:56
  • 1
    \$\begingroup\$ As an alternative to linear interpolation one also could use the fact that 3 points are on the same line if 2nd derivative is zero for the middle point: mask[1:-1] = np.diff(pattern, n=2) != 0 \$\endgroup\$
    – Georgy
    Commented Feb 8, 2018 at 20:26
  • \$\begingroup\$ Hmm, that's an interesting idea also. Wow, I really went about it the wrong way. \$\endgroup\$ Commented Feb 8, 2018 at 23:09
10
\$\begingroup\$

You can use Ramer Douglas Peuker algorithm. RDP takes a curve and eliminates points that are close to straight lines. It is distance based. Starting with the two endpoints, it forms a line and picks the point furthermost away from it. That point is used to form line segments and iterate until all the remaining points are close to the line.

Python has an RDP package you can use. All you need to do is define how straight you want the lines to be.

Result:

enter image description here

\$\endgroup\$
1
  • \$\begingroup\$ Good one, that is nice. \$\endgroup\$ Commented Feb 9, 2018 at 2:12
4
\$\begingroup\$

This is not really a code review, but an alternative approach to solving your problem.

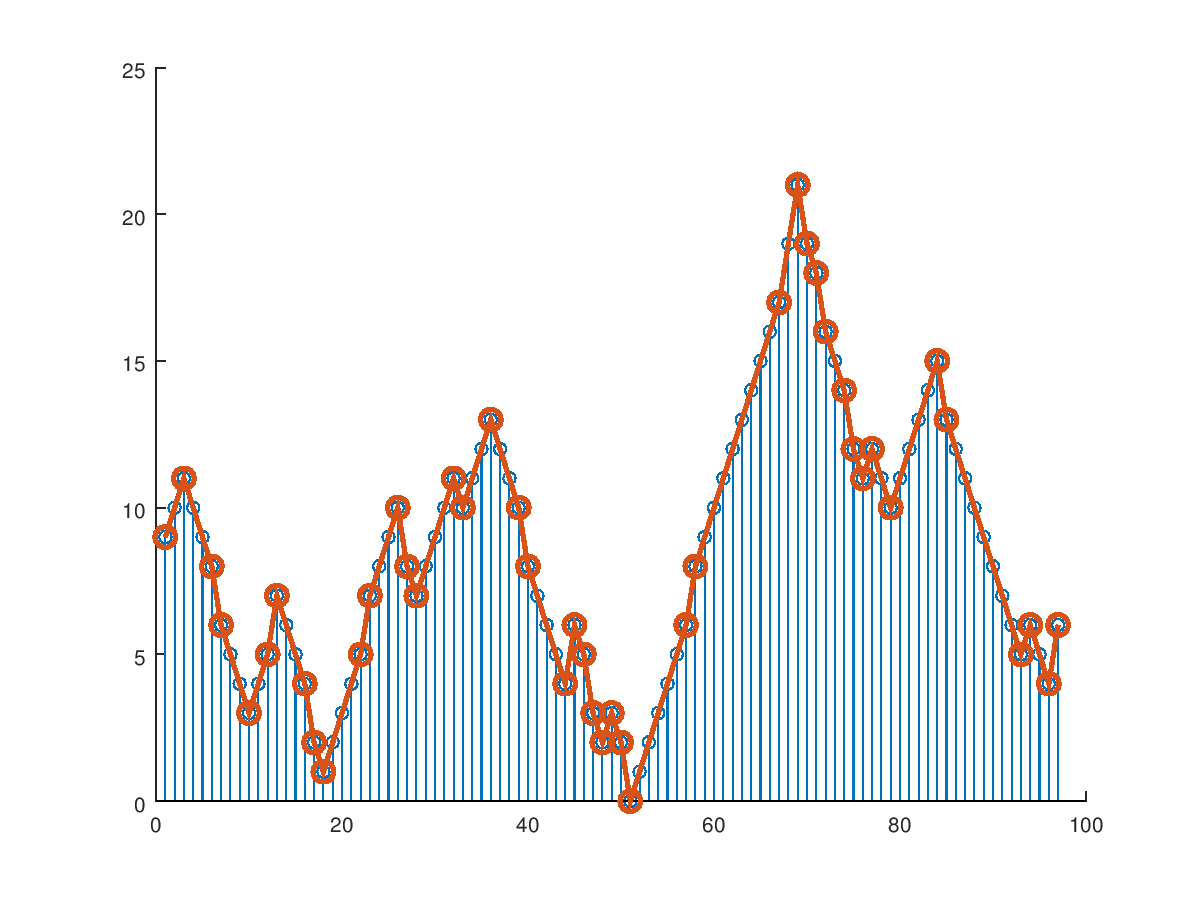
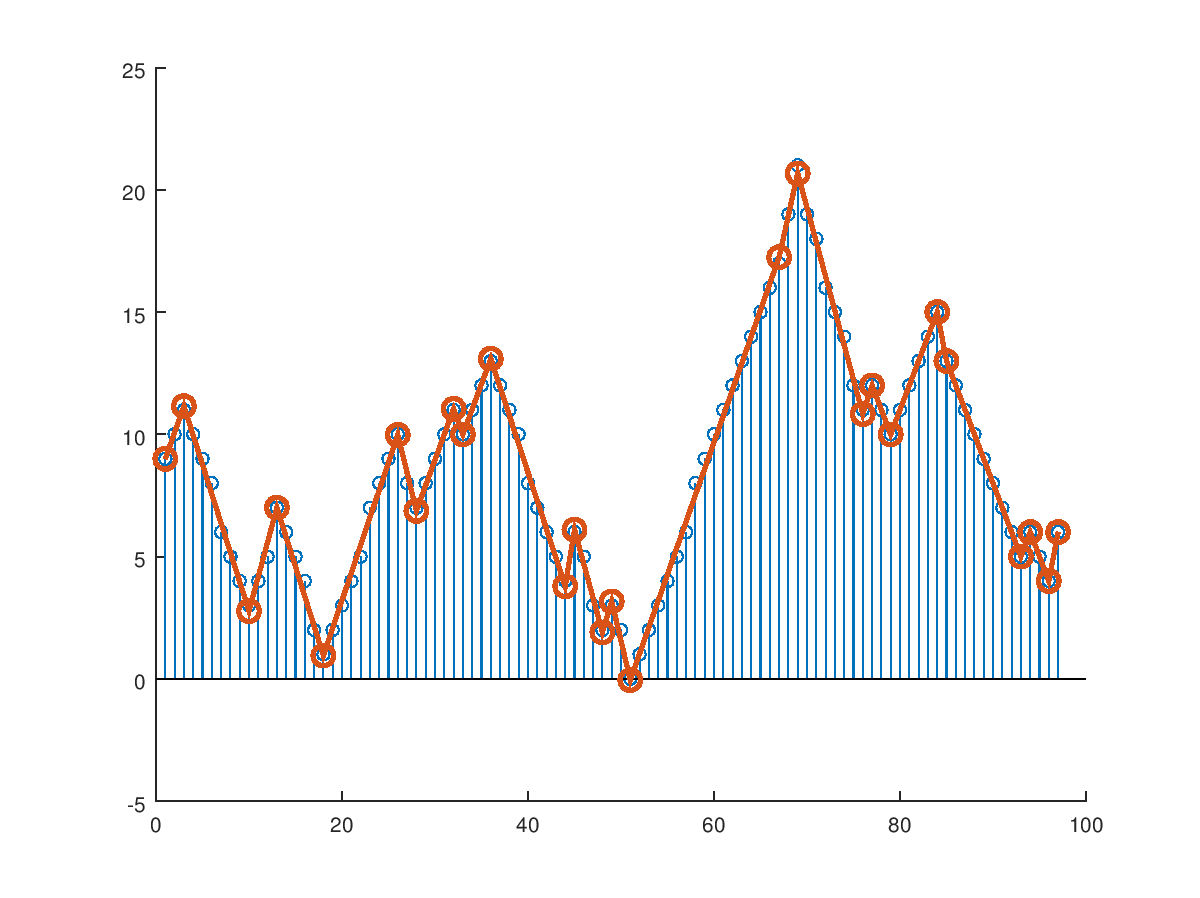
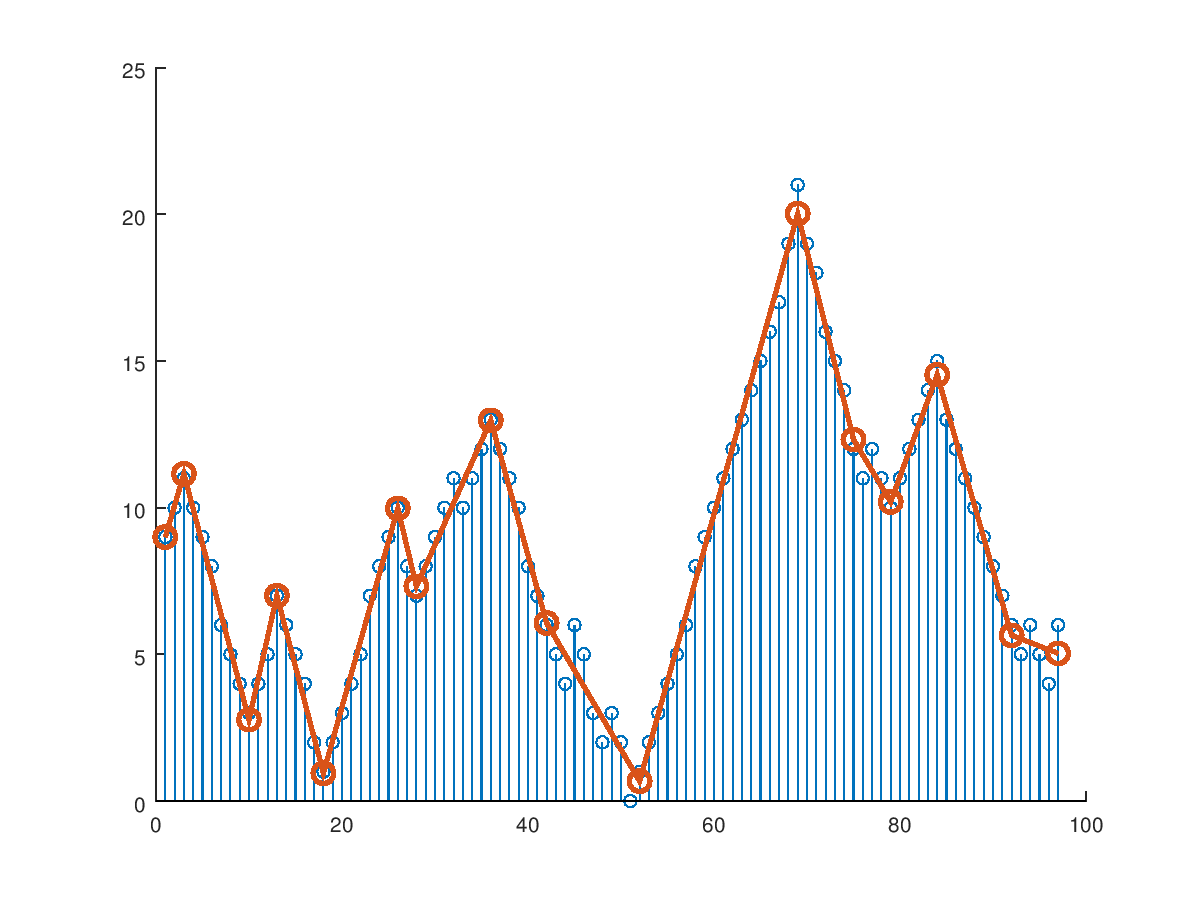
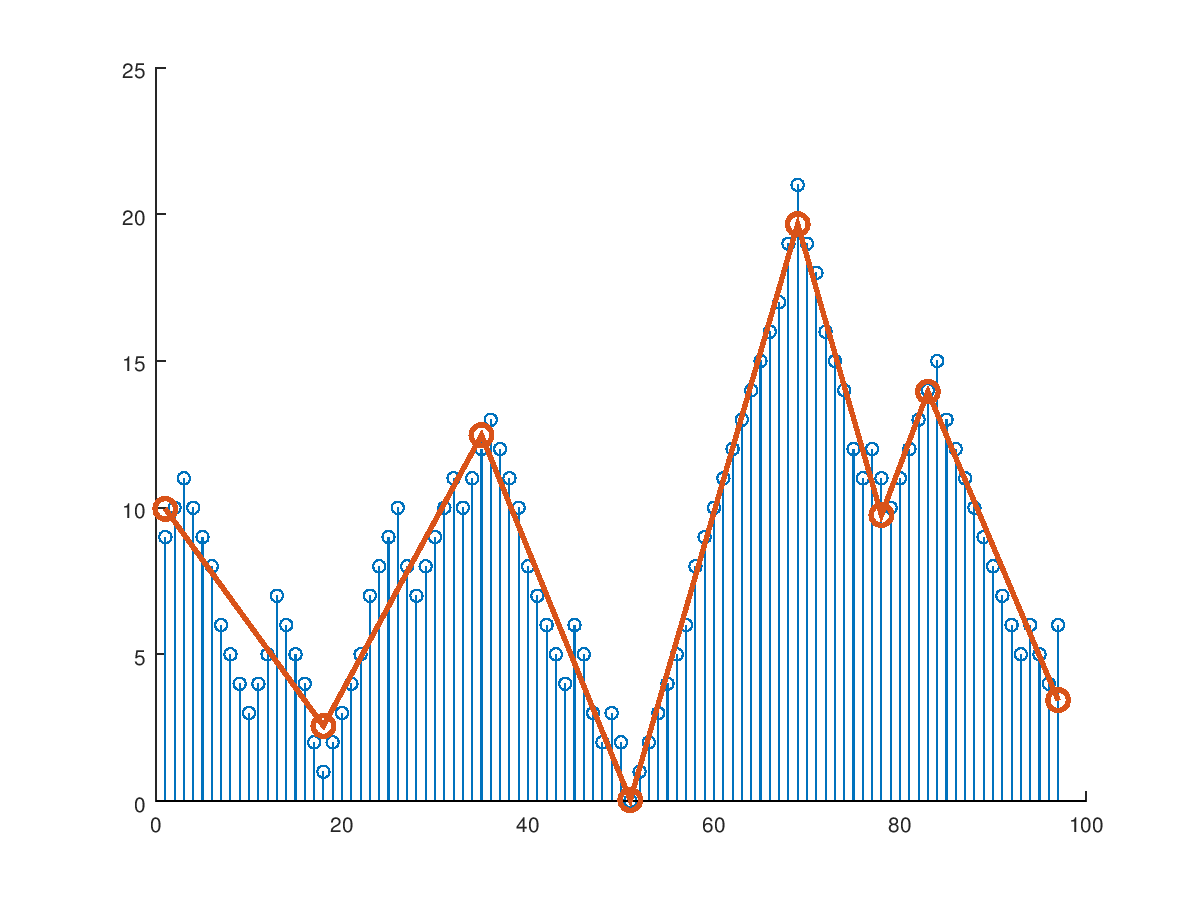
I did my doctoral thesis on bicriterion fitting of polylines to noisy data series. The two criteria are the number of segments and the mean-square estimation error. A weight parameter allows trading off between the two. Here are some results using your data and different values of the tradeoff parameter:

0.1

tradeoff = 0.1

1.0

tradeoff = 1.0

4.0

tradeoff = 4.0

20.0

tradeoff = 20.0

Importantly, as the number of segments decreases, the resulting points are chosen to minimize error and are not restricted to be equal to any of the input points (since they are assumed to be corrupted by noise).

I don't have a python version of the code to share with you, but the algorithm (which is a dynamic programming approach) is described online at https://repository.upenn.edu/edissertations/1158/

I suggest looking at the plots showing error performance and computational complexity rather than trying to reproduce the code. If this is what you are wanting, I could be convinced to collaborate on a python binding.

\$\endgroup\$
1
  • \$\begingroup\$ Wow, thanks for sharing your work! I'm reading your thesis now. \$\endgroup\$ Commented Feb 9, 2018 at 21:19

Your Answer

By clicking “Post Your Answer”, you agree to our terms of service and acknowledge you have read our privacy policy.

Not the answer you're looking for? Browse other questions tagged or ask your own question.