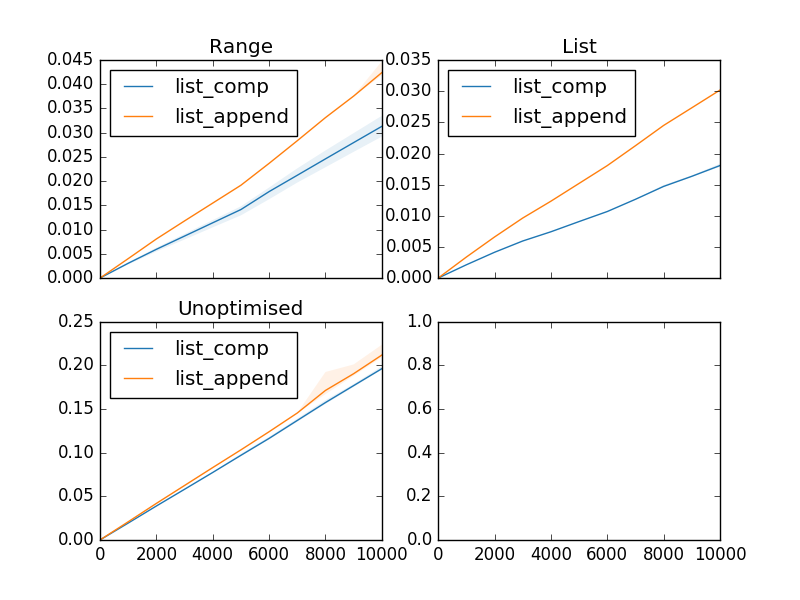
I like to use timeit to measure performance of small, and sometimes big, functions. However it can be uncertain as to what the 'actual' time to execute the function is. It also doesn't clearly show trends in function execution times.
Originally I wanted to measure the difference between list comprehensions and using append continuously. I wanted it to be simple to use, and so tried to abstract the graphing as much as possible. This lead to having to provide the components to timeit at class level. And a flattened list of graphs at function/instance level.
My code still suffers from a couple of the above problems, but reduces them by a reasonable amount. The module is, 'graphtimer.py':
from timeit import timeit
from functools import partial

CATEGORY10 = '#1f77b4 #ff7f0e #2ca02c #d62728 #9467bd #8c564b #e377c2 #7f7f7f #bcbd22 #17becf'.split()
CATEGORY20 = '#1f77b4 #aec7e8 #ff7f0e #ffbb78 #2ca02c #98df8a #d62728 #ff9896 #9467bd #c5b0d5 #8c564b #c49c94 #e377c2 #f7b6d2 #7f7f7f #c7c7c7 #bcbd22 #dbdb8d #17becf #9edae5'.split()
CATEGORY20b = '#393b79 #5254a3 #6b6ecf #9c9ede #637939 #8ca252 #b5cf6b #cedb9c #8c6d31 #bd9e39 #e7ba52 #e7cb94 #843c39 #ad494a #d6616b #e7969c #7b4173 #a55194 #ce6dbd #de9ed6'.split()
CATEGORY20c = '#3182bd #6baed6 #9ecae1 #c6dbef #e6550d #fd8d3c #fdae6b #fdd0a2 #31a354 #74c476 #a1d99b #c7e9c0 #756bb1 #9e9ac8 #bcbddc #dadaeb #636363 #969696 #bdbdbd #d9d9d9'.split()


def _time(setup, fn, amount=1000, number=1000000, command='fn(a)'):
    return timeit(command, setup.format(fn, amount), number=number)


def time(*args, **kwargs):
    return partial(_time, *args, **kwargs)


def flat(axes):
    if 'flat' in dir(axes):
        return axes.flat
    try:
        return [axis for row in axes for axis in row]
    except TypeError:
        return [axes]


class GraphTimer:
    functions = []
    inputs = []
    domain = []
    titles = []
    colors = CATEGORY10

    def _average_and_error_area(self, axis):
        for results in axis:
            average = sum(results) / len(results)
            yield average, results[0], results[-1]

    def _average_and_error_line(self, axis):
        for results in axis:
            average = sum(results) / len(results)
            yield average, average - results[0], results[-1] - average

    def _remove_outliers(self, axis):
        length = len(axis)
        lo = length // 4
        up = (length - 1) - length // 4
        for results in zip(*axis):
            results = list(sorted(results))
            q1 = results[lo]
            q3 = results[up]
            interquartile = 1.5 * (q3 - q1)
            low = q1 - interquartile
            upp = q3 - interquartile
            yield [i for i in results if q1 <= i <= q3]

    def _average_error_area(self, axis):
        return zip(*self._average_and_error_area(self._remove_outliers(axis)))

    def _average_error(self, axis):
        return zip(*self._average_and_error_line(self._remove_outliers(axis)))

    def average_error(self, axis):
        return self._average_error_area(axis)

    def graph_time(self, plt, line, color, box_error=True):
        domain = list(self.domain)
        average, lower, upper = self.average_error(line)
        if box_error:
            plt.fill_between(domain, lower, upper, facecolor=color, color="none", alpha=0.1)
        return plt.plot(domain, average, color=color)[0]

    def graph_times(self, plt, axis, box_error=True, legend=True, title=None):
        lines = [
            self.graph_time(plt, axis, color, box_error=box_error)
            for axis, color in zip(axis, self.colors)
        ]
        if title is not None and 'set_title' in dir(plt):
            plt.set_title(title)
        if legend and 'legend' in dir(plt):
            plt.legend(lines, self.functions, loc=0)
        return lines


    def time_input(self, input, amount=10):
        domain = list(self.domain)
        return [
            [
                [input(function, amount=x) for x in domain]
                for _ in range(amount)
            ]
            for function in self.functions
        ]

    def time_inputs(self, amount=10):
        return (
            self.time_input(input, amount=amount)
            for input in self.inputs
        )

    def plot_axis(self, plt, input, amount=10, box_error=True, legend=True, title=None):
        time = self.time_input(input, amount=amount)
        return self.graph_times(plt, time, box_error=box_error, legend=legend, title=title)

    def plot_axes(self, plts, amount=10, box_error=True, legend=True, show_titles=False):
        times = self.time_inputs(amount=amount)
        titles = iter(self.titles if show_titles else [])
        return [
            self.graph_times(plt, time, box_error=box_error, legend=legend, title=next(titles, None))
            for plt, time in zip(plts, times)
        ]
Both of the functions _average_and_error_area and _average_and_error_line are there as I originally used errorbar rather than fill_between. And may add this back as an option.
Where this is an example of how I would compare using append and a list comprehension:
from itertools import islice

class UnoptimisedRange(object):
    def __init__(self, size):
        self.size = size

    def __getitem__(self, i):
        if i >= self.size:
            raise IndexError()
        return i

def list_comp(iterable):
    return [i for i in iterable]

def list_append(iterable):
    a = []
    append = a.append
    for i in iterable:
        append(i)
    return a

import matplotlib.pyplot as plt
from graphtimer import time, flat, GraphTimer

class Timer(GraphTimer):
    functions = [
        'list_comp',
        'list_append',
    ]
    inputs = [
        time('from __main__ import {} as fn; a = range({})', number=100),
        time('from __main__ import {} as fn; a = list(range({}))', number=100),
        time('from __main__ import {} as fn, UnoptimisedRange as range; a = range({})', number=100),
    ]
    domain = list(range(0, 10001, 1000))
    titles = [
        'Range',
        'List',
        'Unoptimised',
    ]

def main():
    fig, axs = plt.subplots(nrows=2, ncols=2, sharex=True)
    Timer().plot_axes(flat(axs), amount=10, show_titles=True)
    plt.show()

if __name__ == '__main__':
    main()
This sometimes doesn't output the area, for an unknown reason. But I'm ok with that. And can output graphs such as:
Note: There is a GitHub repo for this, licensed under MIT.


_remove_outliersyou computelowanduppbut never use them, is it expected or did you forget to use them in the following comprehension? \$\endgroup\$lowanduppare not used. \$\endgroup\$