5
\$\begingroup\$

I've written a small program that draws a vector field in R using ggplot for a given differential equation.

There is a topic on the subject here however, the proposed solutions either don't provide the same functionality as the code below or don't use ggplot.

//example differential equation: f_prime = f(x,y)

f_prime <- function(x,y){
  return(x^2/(1-x^2-y^2))
}

//set the min and max for the x and y curves
x <- 4      //change if you like
y <- 4
minX <- -x
maxX <- x
minY <- -y
maxY <- y
len <- 40   //number by which the x,y space will be subdivided by
            //larger number => more points and vice versus 

//create an equally spaced grid
data <- data.frame(expand.grid(x = seq(minX, maxX, length.out=len), 
                               y = seq(minY, maxY, length.out=len)))  

//create a new column for the results of (x,y) applied on f_prime  
data$dydx <- mapply(f_prime, data$x, data$y)

A small graphic to visualize the problem:
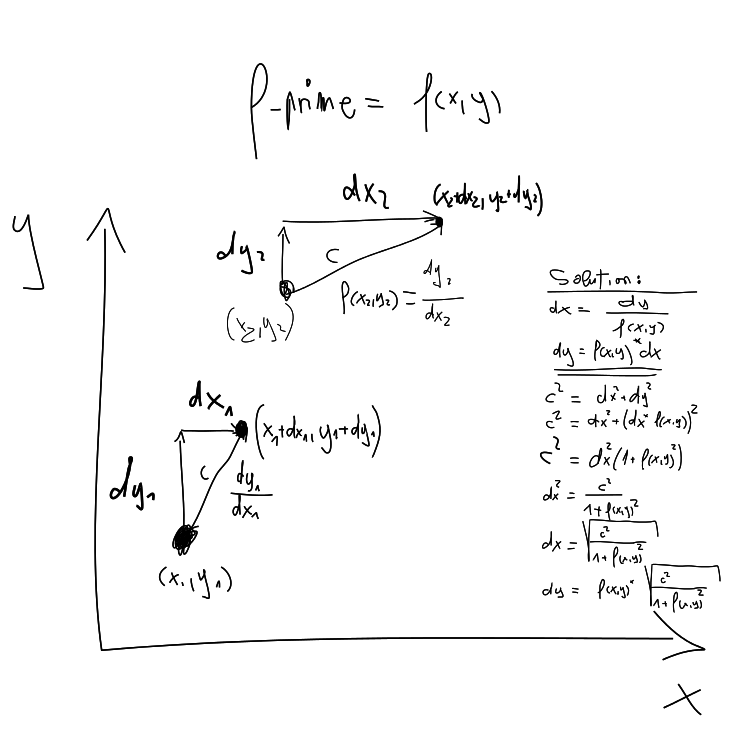
enter image description here

//The next step is important to understand:
//The goal is have arrows that have approx. the same length (c = const) and
//point to the direction of f_prime at some point (x,y) for all points
//Note: f_prime is the derivative of F(x,y) with respect to x,
//hence f_prime provides the relative change in y as a result of a change in x
//Now the problem to draw the arrows can be formulated using f_prime (= dy/dx) 
//and the fact that c^2 = dy^2 + dx^2 (Pythagoras)
//Using basic algebra to solve the problem:
//Solve for dx = dy/f_prime(x,y) and insert into
//c^2 = dy^2 + dx^2 = dy^2 + (dy/f_prime(x,y))^2 and solve for dx
//dx = sqrt(c^2/(1+f(x,y)^2) and
//dy = f(x,y)*dx
//now we can draw the arrows using (x,y) as the start and (x+dx, y+dy) as the end
//translating this into code:

data$dx <- sqrt((1/len)/(1+data$dydx^2))
data$dy <- data$dx*data$dydx
ggplot(data=data, aes(x=x,y=y), environment = environment()) + 
  geom_point(size = 1) + 
  geom_segment(aes(xend=x+dx, yend=y+dy), arrow = arrow(length = unit(0.1, "cm"))) + 
  xlim(minX,maxX) + 
  ylim(minY,maxY) 

Looks like:

enter image description here

Maybe there is a better/faster more elegant way to do it, if yes please share if not happy to help.

\$\endgroup\$
2
  • \$\begingroup\$ What is the rationale for plugging 1/len where you had c^2 in your notes? \$\endgroup\$
    – flodel
    Commented Jun 19, 2015 at 0:54
  • \$\begingroup\$ Practically: The rational is that the arrows don't overlap on the x-axis. If you try out different values you'll see the problem. Mathematically: it is a constant anyway. I mean basically it's the length you want the arrows to be. \$\endgroup\$
    – Vincent
    Commented Jun 19, 2015 at 6:14

1 Answer 1

3
\$\begingroup\$

This will not be faster (which would require you move away from ggplot) but could give you ideas about writing better/cleaner code. The code first:

field_vec_plot <- function(fun, xmin = -1,
                                xmax =  1,
                                ymin = -1,
                                ymax =  1,
                                density = 10) {

  data <- expand.grid(x = seq(xmin, xmax, length.out = density), 
                      y = seq(ymin, ymax, length.out = density))

  data <- within(data, {
     dydx = fun(x, y)
     dx   = sqrt((1 / density) / (1 + dydx ^ 2))
     dy   = dx * dydx
  })

  library(ggplot2)
  library(grid) # for arrow()
  xmar <- (xmax - xmin) / density # margin for x
  ymar <- (ymax - ymin) / density # margin for y
  ggplot(data = data, aes(x = x, y = y)) + 
    geom_point(size = 1) + 
    geom_segment(aes(xend = x + dx, yend = y + dy),
                 arrow = arrow(length = unit(0.1, "cm"))) + 
    xlim(xmin - xmar, xmax + xmar) + 
    ylim(ymin - ymar, ymax + ymar)
}

f_prime <- function(x, y) x ^ 2 / (1 - x ^ 2 - y ^ 2)
field_vec_plot(f_prime, xmin = -4, xmax = 4,
                        ymin = -4, ymax = 4,
                        density = 40)

Some of the recommendations:

  1. Always write a function (with appropriate inputs and outputs)
  2. expand.grid already returns a data.frame
  3. mapply was not needed since f_prime is vectorized. This will be faster but it is probably a drop in the sea compared to plotting.
  4. The use of within to add dependent columns interactively (no need to write data$ over and over and your code is much more readable.)
  5. Make your code (especially the one you posted here) source the packages it requires. I had to look where arrow() was coming from
  6. Do not write code that throws warnings. Read the message carefully and find what the problem is. In this case, it was warning when trying to plot arrows outside the plotting area. Hence I added some margins xmar and ymar to the plotting area.
  7. Personal preference: put some space after commas and on each side of = and binary operators. Also use linebreaks so your lines are never too long and add spaces to make things align when you get a chance.
  8. I have removed your comments because they were not using the R syntax (need # and not //) but that's an easy fix. Yes, comments are good and having a lot of them was great.

Disclaimer: I am not 100% confident that your 1 / density nor my definitions of xmar and ymar are correct, given what you are trying to achieve. Try this for example:

field_vec_plot(f_prime, xmin = -1, xmax = 1, ymin = -1, ymax = 1, density = 10)

where the arrows seem a little too long...

\$\endgroup\$
1
  • \$\begingroup\$ Neat! I did not know about within. @Disclaimer: me neither to be honest. I wrote this yesterday and was quite happy with the result. I tried out different functions and all worked quite alright. But from my understanding there is not necessarily a right or wrong here: if you look at the vectorfield function in the pracma package, the arrows don't have the same length (some are longer/shorter then others). But sure, this is certainly a point to discuss. Maybe we get some additional input from someone on this matters. Thank you for your comments. \$\endgroup\$
    – Vincent
    Commented Jun 19, 2015 at 6:23

Your Answer

By clicking “Post Your Answer”, you agree to our terms of service and acknowledge you have read our privacy policy.

Not the answer you're looking for? Browse other questions tagged or ask your own question.