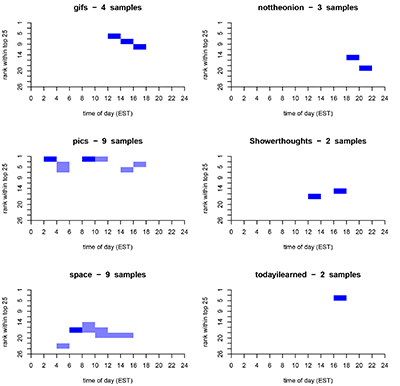
I wrote a script to turn a file like this one into a colored 2D histogram:
xbins, ybins, xmin, xmax, ymin, ymax
12, 12, -0.1, 24, -0.1, 25.1
 0,   0,   0,   0,   0,   0,   0,   0,   0,   0,   0,   0,   0
 0,   0,   0,   0,   0,   0,   0,   0,   0,   0,   0,   0,   0
 0,   0,   0,   0,   0,   0,   1,   0,   0,   0,   0,   0,   0
 0,   0,   0,   0,   0,   0,   0,   2,   0,   0,   0,   0,   0
 0,   0,   0,   0,   0,   0,   0,   0,   1,   0,   0,   0,   0
 0,   0,   0,   0,   0,   0,   0,   0,   0,   0,   0,   0,   0
 0,   0,   0,   0,   0,   0,   0,   0,   0,   0,   0,   0,   0
 0,   0,   0,   0,   0,   0,   0,   0,   0,   0,   0,   0,   0
 0,   0,   0,   0,   0,   0,   0,   0,   0,   0,   0,   0,   0
 0,   0,   0,   0,   0,   0,   0,   0,   0,   0,   0,   0,   0
 0,   0,   0,   0,   0,   0,   0,   0,   0,   0,   0,   0,   0
The structure of the file is that the first 2 lines provide the parameters that were used to general the 2D histogram with a C++ program. I am aiming for readability and efficiency in the code, and I would like to make the script as R-like as possible as I haven't done much coding in R.
# This script generates a PDF of plots for all 2D histograms stored in the working directory with file names in the expected format, as determined by formatting parameters below
# An example product PDF is included with the Github files

##################################
#FORMATTING & PLOTTING PARAMETERS#
##################################


# This variable should be set equal to a value near the largest frequency you expect in a single histogram bin for
# values of interest. Variable num_colors bins will be generated from 0 to this reasonable_upper_density_bound.
# A final catch-all bin will be added to cover values greater than this value and less than or equal to 1.
reasonable_upper_density_bound <- .2

# Number of colors to spread uniformly between 0 and reasonable_upper_density_bound
num_colors                     <- 15

# Designate format and type of files script will use in directory create 2D histograms
to_keep                        <- "_byX_"
file_extension                 <- "txt"

# Set graphing parameters for output pdf
max_num_files                  <- 50
graphs_per_page                <- 6
pdf_name                       <- "All_REDDITS"
label_for_x                    <- "time of day (EST)"
label_for_y                    <- "rank within top 25"

######################################
#END FORMATTING & PLOTTING PARAMETERS#
######################################


# Create list of files that match desired format
files <- list.files()
files <- files[substring(files, nchar(files)-2, nchar(files)) == file_extension]
files <- files[substring(files, 1, 4)!="subr"]    # Specific to the Reddit data mining application
files <- files[substring(files, 1, 4) !="anno"]   # Specific to the Reddit data mining application
files <- files[grep(to_keep, files)]

# Name destination pdf
pdf_name <- paste0(pdf_name, to_keep, ".pdf")
pdf(pdf_name)

# Outer for-loop runs once per page of pdf file
for(i in 0:ceiling(max_num_files/graphs_per_page)){

  # Setting graphical parameters and desired graphs for current pdf page
  par(mfrow=c(graphs_per_page/2,2))
  desired_indices <- c((1+i*graphs_per_page):(graphs_per_page+i*graphs_per_page))

  # Inner for-loop runs for each histogram generated on each page
  for(filename in files[desired_indices]){

    # Content files contain first 2 lines as parameter dataframe
    # Rest of file is 2D histogram, x-values are columns and y-values are rows
    all_content    <- readLines(filename)

    first_two      <- all_content[c(1, 2)]
    graphing_parameters     <- read.csv(textConnection(first_two))

    skip_first_two <- all_content[c(-1, -2)]
    data2D         <- read.csv(textConnection(skip_first_two), header=FALSE)


    # Normalize the 2D histogram to sum to 1
    norm_factor  <-  sum(colSums(Filter(is.numeric, data2D)))
    data_mat     <- data.matrix(data2D[ , 1:(ncol(data2D))])
    data_rotated <- apply(data_mat, 2, rev)    # Rotate data to conform to image() function layout
    data_rotated <- data_rotated/norm_factor

    # Create image of 2D histogram using graphing parameters set at top of script
    image( c(0:(ncol(data_rotated))), c(0:(nrow(data_rotated))), t(data_rotated),
           breaks = c(seq(0, reasonable_upper_density_bound, length.out = num_colors), 1),
           col=colorRampPalette(c(rgb(0,0,1,0), rgb(0,0,1,1)), alpha = TRUE)(num_colors), axes=FALSE,
           xlab=label_for_x, ylab = label_for_y)

    # Title is set by file name and sum of unnormed histogram so readers know how many data points (sum of all data points in all series) contribute to a given histogram
    mainTitle <- substring(filename, 1, (nchar(filename) - (nchar(file_extension) + 1) - nchar(to_keep)))
    mainTitle <- paste(mainTitle, " - ", norm_factor, " samples")
    title(main=mainTitle)

    #axes are set according to parameter dataframe at top of data file
    axis(1, c(0:(ncol(data_rotated))), round(seq(from = graphing_parameters$xmin[1], to= graphing_parameters$xmax[1] , length.out = (graphing_parameters$xbins[1] + 1)), digits=0))
    axis(2, c(0:(nrow(data_rotated))), round(seq(from = graphing_parameters$ymax[1] + 1, to=graphing_parameters$ymin[1] +1, length.out = (graphing_parameters$ybins[1] + 1)), digits=0))
  }
}
dev.off()
A page looks like this:

