6
\$\begingroup\$

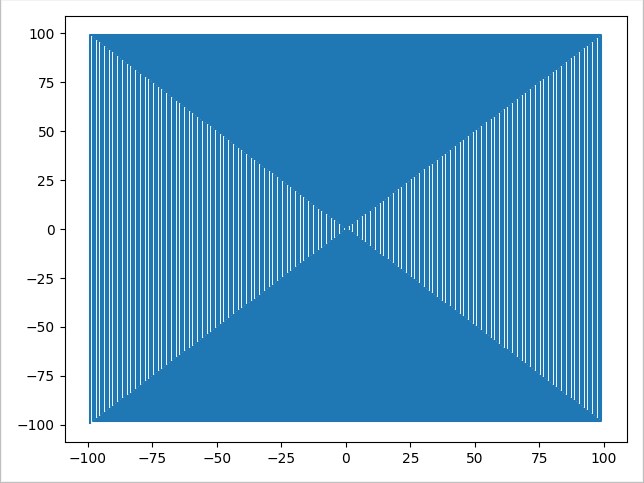
This program is made, so it graphs a spiral with N steps. What else could I add to this program?

Can this code be improved?

import matplotlib.pyplot as plt

N = 100
arr = [(0, 0)]
x = []
y = []

for u in range(1, N):

    for i in range(1, 5):
        if i % 4 == 1:                      # first corner
            arr.append((u, - u + 1))

        elif i % 4 == 2:                    # second corner (same positive numbers)
            arr.append((u, u))

        elif i % 4 == 3:                    # third corner (same [one positive and one negative] numbers)
            arr.append((-u, u))

        elif i % 4 == 0:                    # fourth corner (same negative numbers)
            arr.append((-u, -u))

print(arr)                                  # just to easily check all coordinates

for i in arr:
    x.append(i[0])
    y.append(i[1])


plt.plot(x, y)
plt.show()
\$\endgroup\$

3 Answers 3

12
\$\begingroup\$

Your inside for loop is useless as it loops over 4 values ([1,2,3,4]) and you have 4 if insinde it. you could have:

N = 100
arr = [(0, 0)]

for u in range(1, N):
    # first corner
    arr.append((u, - u + 1))
    # second corner
    arr.append((u, u))
    # third corner
    arr.append((-u, u))
    # fourth corner
    arr.append((-u, -u))

# Transforms [(x1, y1), (x2, y2)...] in x = (x1, x2...) y = (y1, y2...)
x, y = zip(*arr)
plt.plot(x, y)
\$\endgroup\$
10
\$\begingroup\$

Instead of redundant traversal and append to multiple lists - use an efficient generator function with further zip call to aggregate the needed x, y coords sequences:

import matplotlib.pyplot as plt


def spiral_coords_gen(n=100):
    yield 0, 0
    for i in range(1, n):
        yield i, -i + 1
        yield i, i
        yield -i, i
        yield -i, -i


x, y = zip(*spiral_coords_gen())
plt.plot(x, y)
plt.show()

The output:

enter image description here

\$\endgroup\$
2
  • \$\begingroup\$ hey, sorry for late response. I don't completely understand what does the "yield" function do in this case. \$\endgroup\$
    – Murg
    Commented Mar 21, 2020 at 20:45
  • \$\begingroup\$ @urbanpečoler docs.python.org/3/glossary.html#term-generator \$\endgroup\$ Commented Mar 22, 2020 at 10:00
7
\$\begingroup\$

Except for what @Cal wrote, you can get rid of the zipping as well:

N=100
x=[0]
y=[0]
for u in range(1, N):
    x += [u, u, -u, -u]
    y += [1-u, u, u, -u]

plt.plot(x, y)
\$\endgroup\$
2
  • \$\begingroup\$ Approaching code golf, but if N is fixed it could be written as N=100 x=[0] y=[0, 0] for u in range(1, N): x += [u, u, -u, -u] where x would also be y. The issue is that there is one too many elements at the end of y. \$\endgroup\$
    – alexyorke
    Commented Mar 4, 2020 at 4:01
  • 1
    \$\begingroup\$ @alexyorke my solution puts stress on readability. Your solution is not at first glance obvious why that is the case. And unless the plot function can ignore the extra y coordinate, it is meaningless. And even if it could, it Is not very smart to rely on such behaviour. \$\endgroup\$
    – slepic
    Commented Mar 4, 2020 at 6:51

Your Answer

By clicking “Post Your Answer”, you agree to our terms of service and acknowledge you have read our privacy policy.

Not the answer you're looking for? Browse other questions tagged or ask your own question.